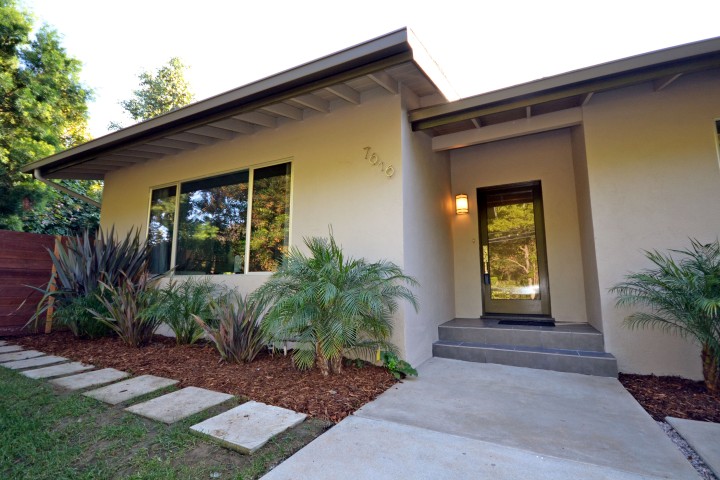
Some buyers are looking for the quick return. Sometimes it happens, but you can’t count on it. Real estate is a long term play that has historically produced wealth for most participants. This is especially true when comparing it to renting. Keep in mind everyone needs a roof over their head. And in most cases, it is either you paying a mortgage or paying rent. Let’s compare the numbers.
You buy a home for $1,000,000 today. Some years the market values may go up quickly, other years declines may happen, and some may stay steady. So over the course of 30 years, let’s assume an overall average appreciation rate of 2.35%. Look at the chart below on the left to watch it grow. Compare that to the chart below on the right which illustrates renting a comparable house with the same assumption of 2.35% average annual increases.
| Owning a Home | Paying Rent | |||
| Year | Value | Year | Rent | |
| 2016 | $ 1,000,000 | 2016 | $ 4,500 | |
| 2017 | $ 1,023,500 | 2017 | $ 4,606 | |
| 2018 | $ 1,047,552 | 2018 | $ 4,714 | |
| 2019 | $ 1,072,170 | 2019 | $ 4,825 | |
| 2020 | $ 1,097,366 | 2020 | $ 4,938 | |
| 2021 | $ 1,123,154 | 2021 | $ 5,054 | |
| 2022 | $ 1,149,548 | 2022 | $ 5,173 | |
| 2023 | $ 1,176,562 | 2023 | $ 5,295 | |
| 2024 | $ 1,204,212 | 2024 | $ 5,419 | |
| 2025 | $ 1,232,510 | 2025 | $ 5,546 | |
| 2026 | $ 1,261,474 | 2026 | $ 5,677 | |
| 2027 | $ 1,291,119 | 2027 | $ 5,810 | |
| 2028 | $ 1,321,460 | 2028 | $ 5,947 | |
| 2029 | $ 1,352,515 | 2029 | $ 6,086 | |
| 2030 | $ 1,384,299 | 2030 | $ 6,229 | |
| 2031 | $ 1,416,830 | 2031 | $ 6,376 | |
| 2032 | $ 1,450,125 | 2032 | $ 6,526 | |
| 2033 | $ 1,484,203 | 2033 | $ 6,679 | |
| 2034 | $ 1,519,082 | 2034 | $ 6,836 | |
| 2035 | $ 1,554,781 | 2035 | $ 6,997 | |
| 2036 | $ 1,591,318 | 2036 | $ 7,161 | |
| 2037 | $ 1,628,714 | 2037 | $ 7,329 | |
| 2038 | $ 1,666,989 | 2038 | $ 7,501 | |
| 2039 | $ 1,706,163 | 2039 | $ 7,678 | |
| 2040 | $ 1,746,258 | 2040 | $ 7,858 | |
| 2041 | $ 1,787,295 | 2041 | $ 8,043 | |
| 2042 | $ 1,829,296 | 2042 | $ 8,232 | |
| 2043 | $ 1,872,285 | 2043 | $ 8,425 | |
| 2044 | $ 1,916,283 | 2044 | $ 8,623 | |
| 2045 | $ 1,961,316 | 2045 | $ 8,826 | |
| 2046 | $ 2,007,407 | 2046 | $ 9,033 | |
Why is this important? Because if you choose a 30 year fixed rate loan, your payments don’t go up. And, at the end of the 30 years, if you own the home you have no more payments and a $2,000,000 asset. If you rent, you don’t have the $2,000,000 asset, and you are still paying over $9,000/month, or over $108,000 annually.
Sounds like owning a home is a good long term strategy? That’s because it usually is. Many people build wealth this way and there is no good reason why you can’t participate.


2 Responses
[…] the better because real estate is a long term investment. And, as you saw in my previous article, Owning versus Renting: It’s Easy Math, over the long run values tend to […]
[…] Currently, in Los Angeles, market rents are equal to or higher than the cost of ownership of a home. Why is this important? Because, assuming you get a fixed rate mortgage, year two comes around and while rents climb, your housing cost stays put. I would go into more detail on that concept, but I have already gone over it in my past article, Owning versus Renting: It’s Easy Math. […]